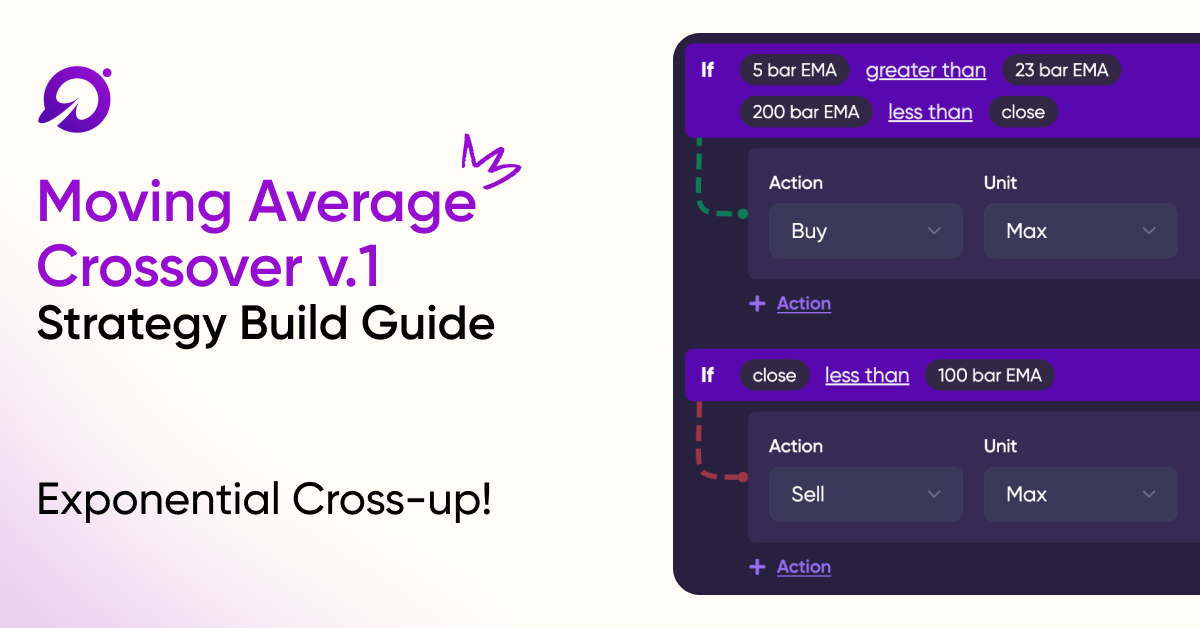
Strategy Design Write-Up: Moving Average Crossover v.1
Exploring the fundamentals of Moving Averages.

Hey guys! This is going to be a post on some strategies that I have backtested and my thoughts on the strategy performance, as well as the backtest procedure and guidelines. I hope to make this a regular thing, where I backtest different strategies every so often and make a post about them. I appreciate any and all feedback or suggestions you may have that may improve either the post layout, or the strategy design itself. Hope you enjoy this post. More to come in the future. (Crossposted from r/PlutoCapital, be sure to check out our subreddit as well!)
Part 1: The Strategy Ruleset
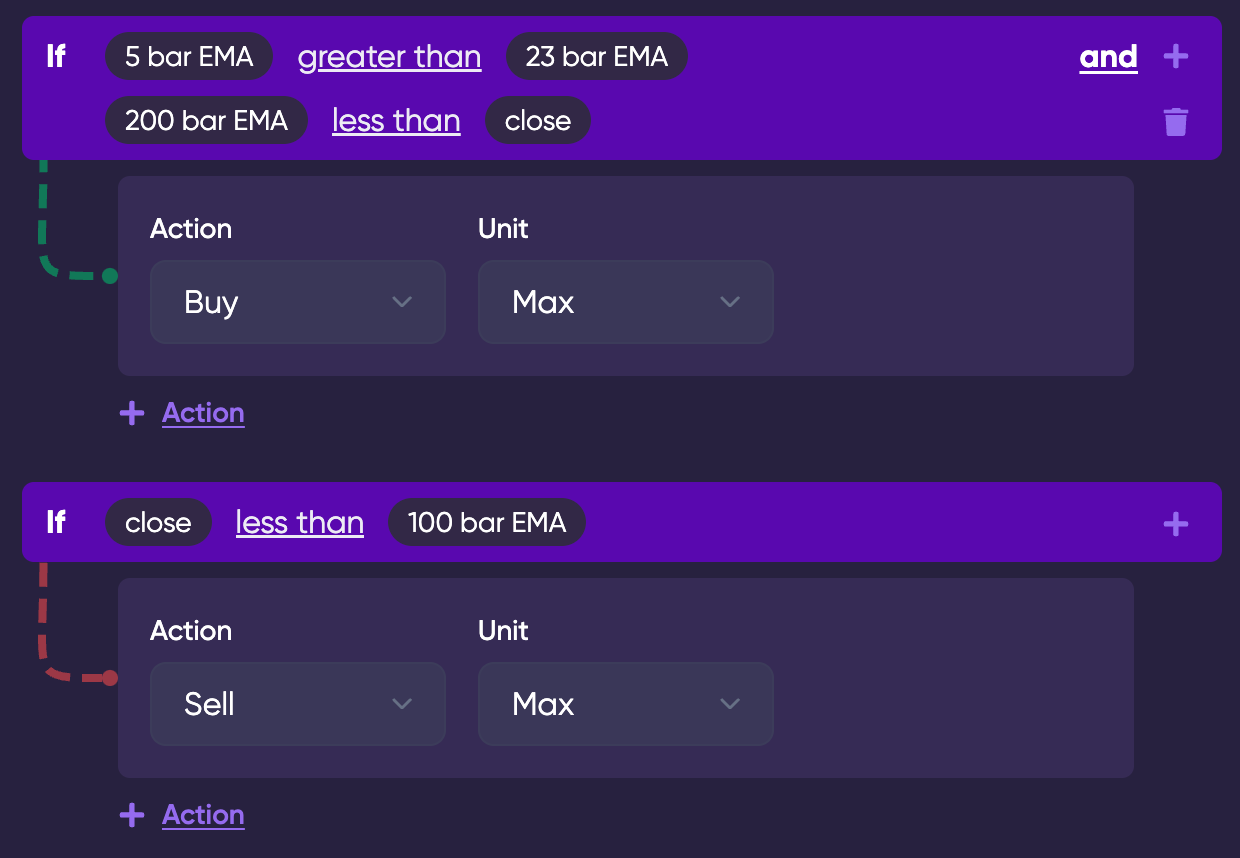
This was an extremely basic strategy based on a moving average crossover event. The reason for choosing Exponential moving averages (EMA's) instead of Simple moving averages (SMA's) was due to the more responsive nature of EMA's which causes them to lag behind a lot less. This allows us to enter trades quicker once our conditions have been met.
Next, I chose to have a 5 bar EMA cross over a 23 bar EMA to the upside, for the simple reason that these are Fibonnaci numbers. Having used Fibonnaci sequences very successfully in my trading previously, I wanted to see if they worked for an MA crossover. I also decided to implement one more entry condition to the ruleset, and this is that the 200 bar EMA must be less than the close. What this means, is that the closing price of a candlestick on the chart, must be greater than the 200 bar EMA, essentially also being a crossover of the price over the EMA. I set it to buy "MAX" when these conditions were met.
Finally, the exit criteria: Close the trade (sell the previously bought shares), as soon as the closing price of a candlestick is less than the 100 bar EMA. I chose this as I thought it may have worked better than simply reversing the crossover, from previous experience with MA crossovers. Honestly though, I may have to backtest both scenarios and compare them side-by-side.
Part 2: The Assets Traded

I will be fully honest here, I chose these stock simply because they were the first few to pop into my head. Absolutely no intelligent reason for it, nothing I could write paragraphs about. But truly, this is probably how most people will choose their stocks, so I feel it's realistic to an average persons beginner portfolio. Anyway, its a diverse, well known collection of companies, with dividend stocks such as KO, and F, Large caps such as AAPL, growth stocks such as NVDA, TSLA and SNAP, and even a recent EV IPO in FSR. Everything you would ever want.
Part 3: The Settings

I would 100% define this strategy as trend following, so I labelled it as that type. I chose the timeframe of each candlestick to be the 1 hour, meaning it would be classed as day/swing trading and hopefully have a good few setups occur. I also chose to allow short positions, although I have no clue why, given that the ruleset of the strategy by default only allows long trades. One other thing was my decision to not include pre/post market hours. This is simply because I have never personally traded shares outside of market hours.
Part 4: The Backtest Scenario

I set the backtest to start before the Covid crash, and to finish on the day I made this post. That gave over 2 years of data, which surely could be considered enough, even given the uniqueness of the market within that specific timeframe. Going on the hourly chart as well, would amplify the timeframe, as this would mean roughly 10 times as much data, over the daily chart. This timeframe includes many drawdowns in the market, which should heavily affect the results of the strategy if it is a poor strategy.
Part 5: The Results

This strategy returned an A!!!! With 115% returns, I would be happy to run it in real time and let it trade for me. That is an annual return of 51%, well above the usual benchmarks.
A closer look into the results:

Overall, the strategy had amazing results, in almost every area. One thing I want to address further though, is the win rate, which was apparently very low. With the average trade making money, and the overall return so positive, I am happy to run a low win rate strategy.

It is quite clear from the chart above, that the losses were kept minimal, and wins were let run, with many multiple wins returning over 10%, while only 1 singular trade lost more than 10%. And this is out of 787 total trades, a quite significantly high number of trades over a significant period of time.
The risk report also shows amazing results:

Example of Best Trade:

Example of Worst Trade:

And now, for some experiments. I identified areas which could potentially lead to optimization in the strategy. Now, I will test those "optimizations" and see what actually works better and what just makes it worse. The way to carry out scientific experiments is to always have only one singular variable, and maintain everything else as constants. This way, you can guarantee that the change in outcome is due to the variable which has been changed, when compared to the previous experiment. For the most part, I have carried out each of the following experiments according to this rule.
Experiment 1: Different Length EMA's
- 10 bar greater than 20 bar: 114.83% gains - Practically no change
- 10 bar greater than 50 bar: 107.68% gains - Slight reduction
- 10 bar greater than 100 bar: 112.14% gains - Practically no change
- 10 bar greater than 200 bar: 118.48% gains - Slight increase (came with reduced win rate)
- 5 bar greater than 200 bar: 119.46% gains - Slight increase (came with reduced win rate)
- 5 bar greater than 10 bar: 117.24% gains - Practically no change
- 5 bar greater than 50 bar: 110.23% gains - Slight reduction (came with higher win rate)
- 5 bar greater than 100 bar: 113.77% gains - Practically no change
- 50 bar greater than 100 bar: 103.81% gains - moderate reduction
- 50 bar less than close: 127.67% gains - moderate increase (came with reduced win rate)
- 100 bar less than close: 127.24% gains - moderate increase
- 150 bar less than close: 126.6% gains - moderate increase
(All with 50 bar less than close):
- Close less than 50 bar: 175.33% gains - significant increase
- Close less than 150 bar: 124.07% gains - moderate increase
- Close less than 200 bar: 120.36% gains - Slight increase
- Close less than 20 bar: 166.11% gains - significant increase
- Close less than 55 bar: 155.79% gains - significant increase
Experiment 2: SMA's instead of EMA's
- 5 bar SMA greater than 23 bar SMA: 113.77% gains - Practically no change
- Everything SMA: 95.22% gains - Moderate reduction
Experiment 3: Greater amount of stocks chosen
- Meme stocks (including GME, AMC, BB etc): 750.49% gains - significant increase (came with reduced win rate)
- Dividend stocks (including KO, PG, JNJ etc): 16.08% gains - significant reduction
Experiment 4: Different Timeframe
- 1 day: 86.9% - Significant reduction
- 2 hours: 45.28% - significant reduction
Experiment 5: Include pre/post market trading
- 112.16% gains - Practically no change
Experiment 6: Greater length of backtesting period
- 1st of July 2019 - 5th of May 2022 (max allowable time): 147.55% gains - Practically no change
Hope this helps provide some more insight into the variables associated with strategies, and the impact these variables have on the strategy performance. Cheers for now!