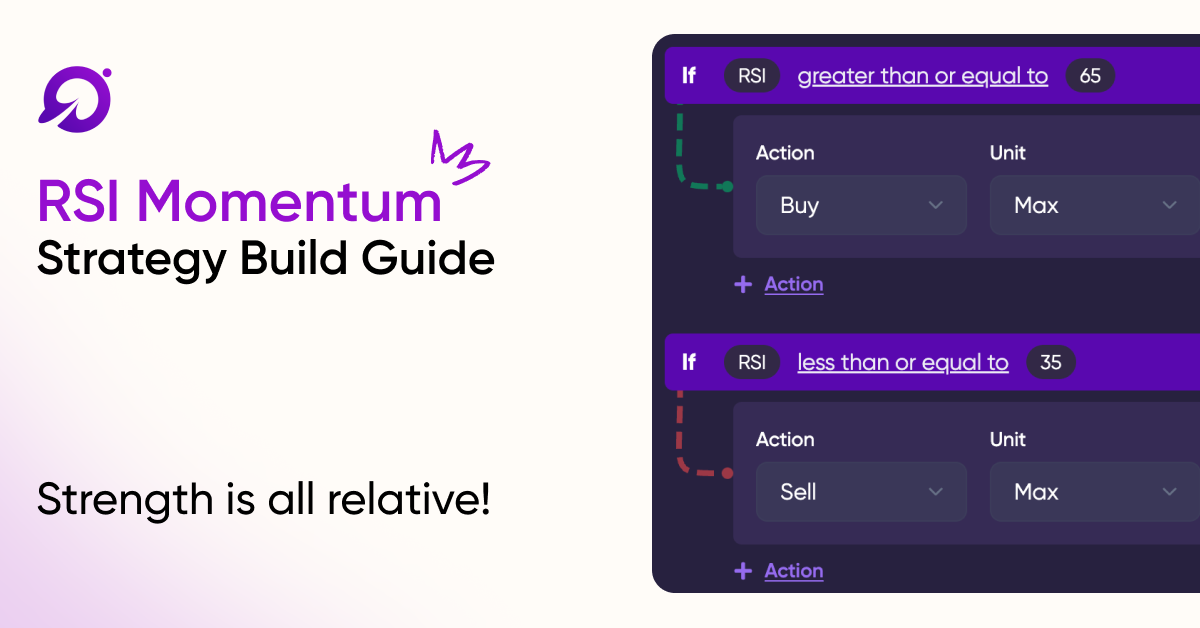
Strategy Design Write-Up: RSI Momentum
RSI momentum Write-up!

Hey guys,
This is going to be another post on strategies that I have backtested and my thoughts on the strategy performance, as well as the backtest procedure and guidelines. I appreciate any and all feedback or suggestions you may have that may improve either the post layout, or the strategy design itself. Hope you enjoy this post.
About the RSI indicator:
The relative strength index (RSI) is a momentum indicator used in technical analysis that measures the magnitude of recent price changes to evaluate overbought or oversold conditions in the price of a stock or other asset.
Part 1: The Strategy Ruleset
This strategy is based upon using the momentum indicated by the RSI to follow the trend. To do this, I set it to buy when the RSI was equal to or greater than 65, and short when it was less than or equal to 35. ie. enter a long trade when RSI crossed 65 to the upside, and enter a short trade when RSI crossed 35 to the downside. The exit criteria was a simple reverse of the trade, or a cross of 65 to the downside, and a cross of 35 to the upside. The idea is that these figures represent a slowing of the momentum, and a possible reverse in trend direction.
The strategy is a relatively simple concept, and the assumption can be made that it would perform equally well in both bull and bear markets, but the obvious flaw is that it may not perform well at all in sideways or choppy markets.
Part 2: The Assets Traded
Similar enough to the stocks I chose for the last strategy I made, this is a relatively diverse list of stocks. Not a huge list, but enough for a basic sample of the strategy to run an initial test.
Part 3: The Settings
Same settings as the last strategy. I would 100% define this strategy as trend following, so I labelled it as that type. I chose the timeframe of each candlestick to be the 1 hour, meaning it would be classed as day/swing trading and hopefully have a good few setups occur. I also chose to allow short positions. One other thing was my decision to not include pre/post market hours. This is simply because I have never personally traded shares outside of market hours.
Part 4: The Backtest Scenario
I set the backtest to start before the Covid crash, and to finish on the day I made this post. That gave over 2 years of data, which surely could be considered enough, even given the uniqueness of the market within that specific timeframe. Going on the hourly chart as well, would amplify the timeframe, as this would mean roughly 10 times as much data, over the daily chart. This timeframe includes many drawdowns in the market, which should heavily affect the results of the strategy if it is a poor strategy.
Part 5: The Results
Not bad! Got a B overall, with 57.71% returns, for an average annual return of around 25%. This seems decent, although simply buying and holding most of the stocks chosen would have returned more over this period of time.
A closer look into the results:
The risk report is what impresses me most here. The max drawdown is less than a sixth of what the stocks I chose lost. I feel this could be attributed to the strategies ability to short that I included in the rules. Therefore taking advantage of the downtrends each stock faced.
One thing I want to address is the low average trade return. While I am glad it is positive, I feel it could definitely be better.
There was a huge amount of trades taken, and a satisfactory win rate which helped turn that small average return into a good overall return. But the largest trade % was a loss of over 40%, which is worrying. I think it may have performed better if I used a larger timeframe to filter the "noise" better and take less trades, but have each one be more successful.
Daily Timeframe:
Ok, so it turns out the larger timeframe did not actually produce better results. Interesting. My theory was proven wrong.
Part 6: Potential For Optimization
- Different RSI settings
- Different exit criteria
- Greater amount of stocks chosen
- Smaller timeframe
- Greater length of backtesting period